
How to Stream Unity Logs from Your Game


When developing your game, you’ll often use Unity’s Debug class to log messages to the console. But how can you see Unity logs at runtime on a device or in a release build?
Sometimes you need to see Unity logs from a built game to debug issues as they happen. Maybe you have a bug that only reproduces on Android and only when your friend is playing on Wednesdays. This article will show you how to stream Unity logs live from your running game.
This article covers viewing a live log stream. But sometimes, the problem has already happened, and you need to retrieve Unity’s log file. See: How to download and view Unity logs from your game.
Table of Contents
- Quick Comparison: Best way to stream Unity logs
- Method 1: Connect with the Unity Editor console
- Method 2: Use adb logcat (Android only)
- Method 3: Browser Developer Tools (WebGL only)
- Method 4: Add Proxima Inspector to your game and connect with any browser
- Bonus Tip: How to enable or disable stack traces for standalone builds
- FAQ: Streaming Unity logs
How to stream Unity logs from your game
Methods 1–3 are built-in options using free tools, but have caveats such as requiring Development Build in your build settings, Developer Mode on your devices, or external tools installed on your PC.
Method 4 uses Proxima Inspector, an asset I published on the Unity Asset Store. Proxima removes these limitations and makes the process much simpler for release builds.
I tested all of the methods below on Unity version 2019.4.
Quick Comparison: Best way to stream Unity logs
If you just want the short version, here’s the fastest way to pick a method:
- Unity Editor Console: Best for quick debugging on local devices with Development Build enabled.
- adb logcat: Best for Android-only issues when you can enable Developer Mode.
- Browser DevTools: Best for WebGL builds running in Chrome or Safari.
- Proxima Inspector: Best for release builds, remote testers, and no-device-access scenarios.
Method 1: Connect with the Unity Editor console
- ✅ Works for Android, iOS, Windows, Mac
- ✅ Can easily search and filter
- ✅ Developer Mode not required
- ❌ Development Build required
- ❌ Requires Unity Editor installed
- ❌ Does not work for WebGL
First, you need to enable Development Build in Unity. Open the Build Settings and check “Development Build” before building your game.
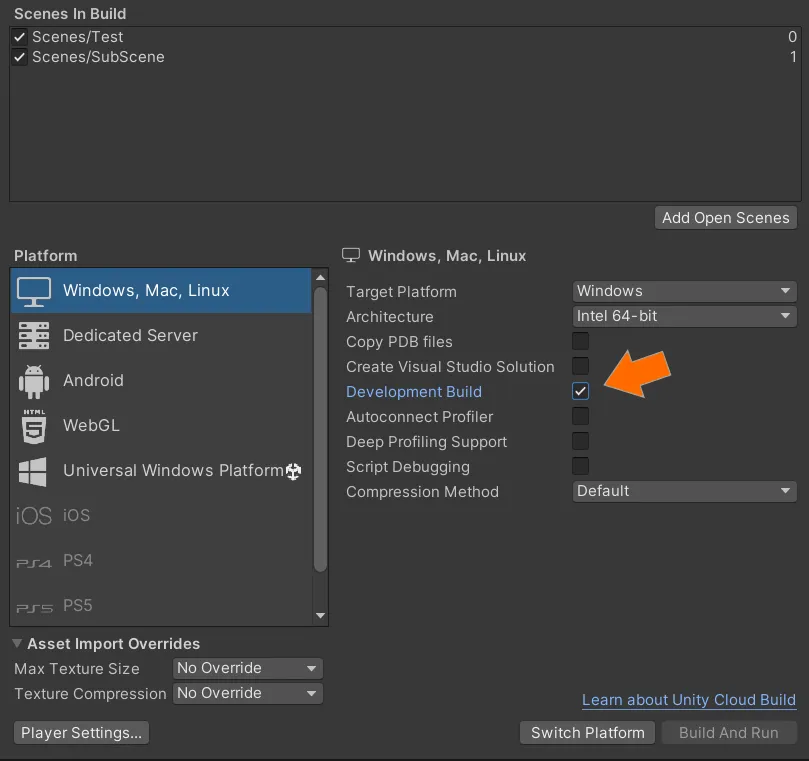
Since the “Development Build” option enables the script debug symbols and the Unity Profiler, it will degrade performance and should not be used in released games. If you want to see a log stream from a release build, consider the other options.
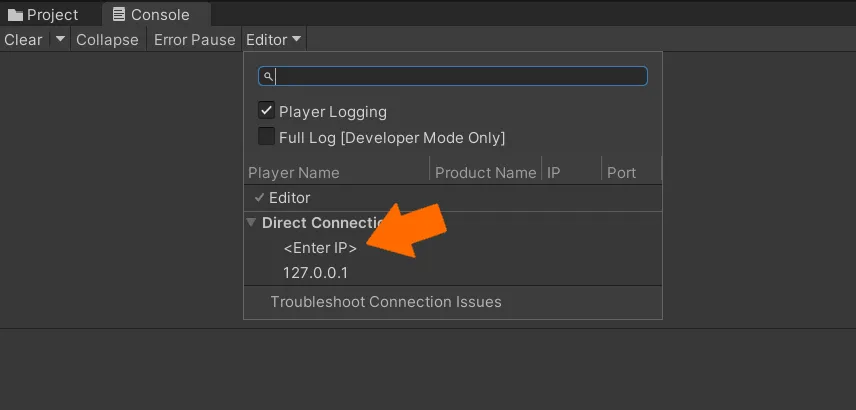
Once your game is running, open the Console and hit the “Editor” dropdown menu. Select your device or click <Enter IP> and enter your device’s IP address. Logs should appear just like they usually do in the editor.
Method 2: Use adb logcat (Android only)
- ✅ Can search and filter (if you know the magic syntax)
- ✅ Development Build not required
- ❌ Android builds only!
- ❌ Developer Mode required
- ❌ Requires external tool (adb)
To use Android Debug Bridge (adb), you need to first turn on developer mode on your device and enable debugging: https://developer.android.com/studio/command-line/adb#Enabling
If you’ve built your app for Android, you should have adb installed by Unity. For me on Windows, it’s here:
C:\Program Files\Unity\Hub\Editor\2021.3.5f1\Editor\Data\PlaybackEngines\AndroidPlayer\SDK\platform-tools\adb.exe
Alternatively, you can install adb here: https://developer.android.com/studio/command-line/adb
Connect your device to your desktop using a USB cable and check that it’s connected:
> adb devices
List of devices attached
1WMHH866PP1314  device
Figuring out the logcat command to filter to your Unity logs is a bit of black magic. Fortunately, I’ve figured it out for you.
# Filter to all Unity messages
> adb logcat -s Unity:V

# Filter to just errors and warnings
> adb logcat -s Unity:W

# Filter to just errors
> adb logcat -s Unity:E

# Filter to a regular expression search string
> adb logcat -s Unity:V MySearchString

# Pipe the output to a file named "log.txt"
> adb logcat -s Unity:V > log.txt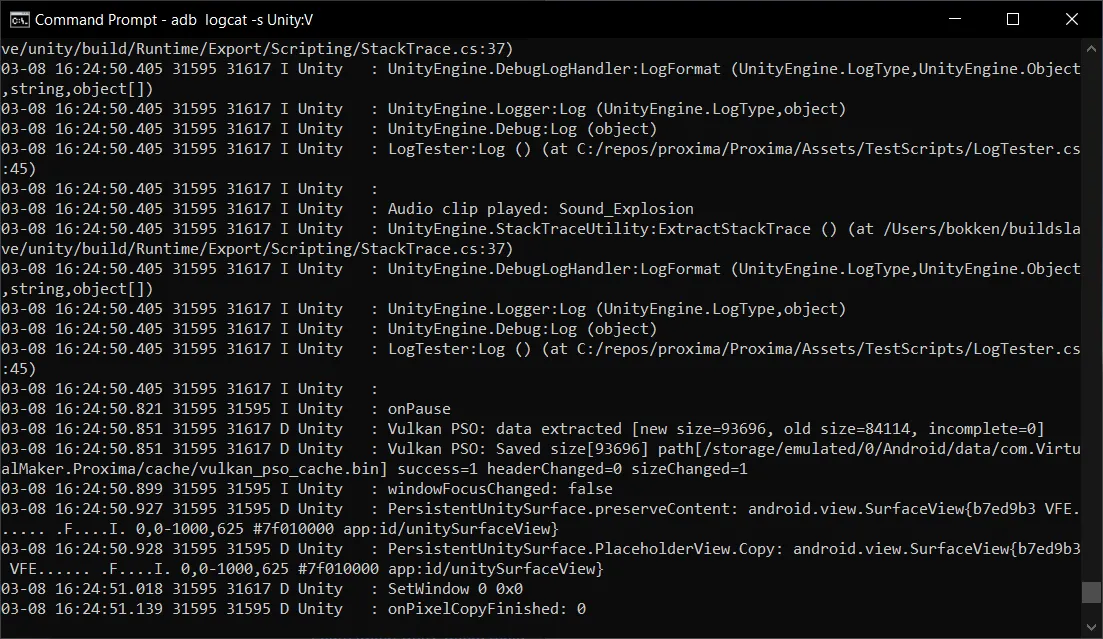
As you can see, the output is not super pretty, especially with stack traces enabled, but it can really help you in a pinch.
Method 3: Browser Developer Tools (WebGL only)
- ✅ Development Build not required
- ✅ Can easily search or filter logs
- ✅ External tools not required
- ❌ WebGL builds only!
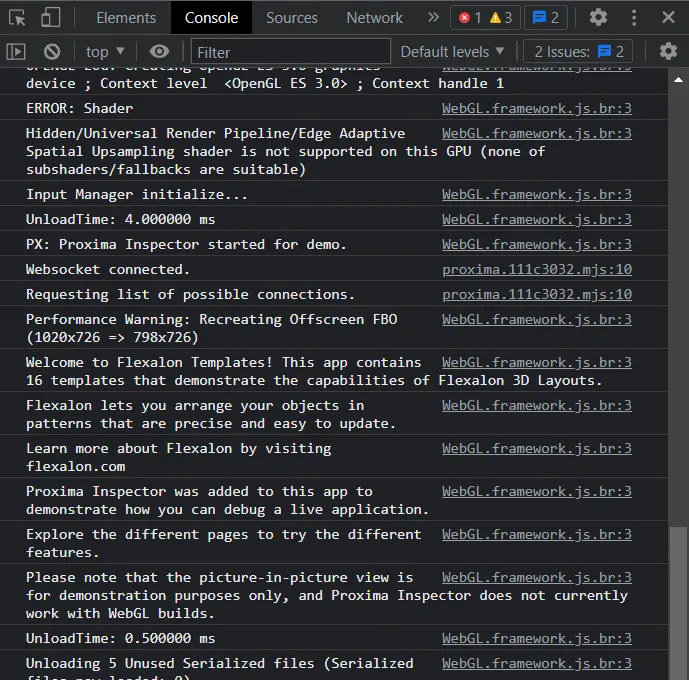
If you’re running your app on desktop, you can easily view logs by opening the Developer Tools (F12) in your browser and navigating to the Console tab.
If your app is running on Chrome on an Android device, you can connect Chrome desktop to the device using remote debugging.
If your app is running on Safari on iOS, you can connect to it on Mac with desktop Safari. I couldn’t find Apple support documentation for this, but here’s what works for me:
- Enable Settings > Safari > Advanced > Web Inspector.
- Connect your device over USB.
- In Desktop Safari go to Develop > Your-Device > Your-Site
Method 4: Add Proxima Inspector to your game and connect with any browser
- ✅ Works for Windows, Mac, Android, iOS
- ✅ Can easily search and filter
- ✅ Development build not required
- ✅ Developer mode not required
- ✅ Unity Editor not required
- ✅ External tools not required
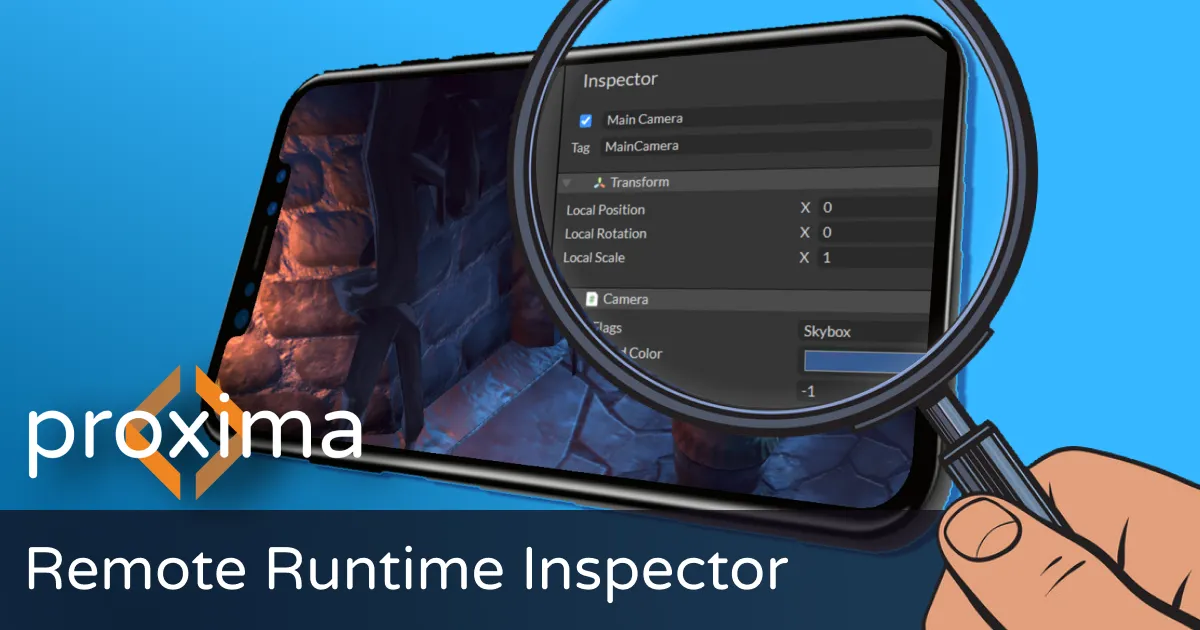
Proxima Inspector is an asset I created to help developers debug live games by mimicking standard editor features like the inspector and log console in the browser. You just add one component to your game, and that’s it. No need to use development builds or enable developer mode on your devices.
For basic functionality like logging, Proxima is free. The pro version offers additional features like creating new game objects, live-editing components, and accessing the powerful remote command line console.
Follow these instructions to install and configure Proxima.
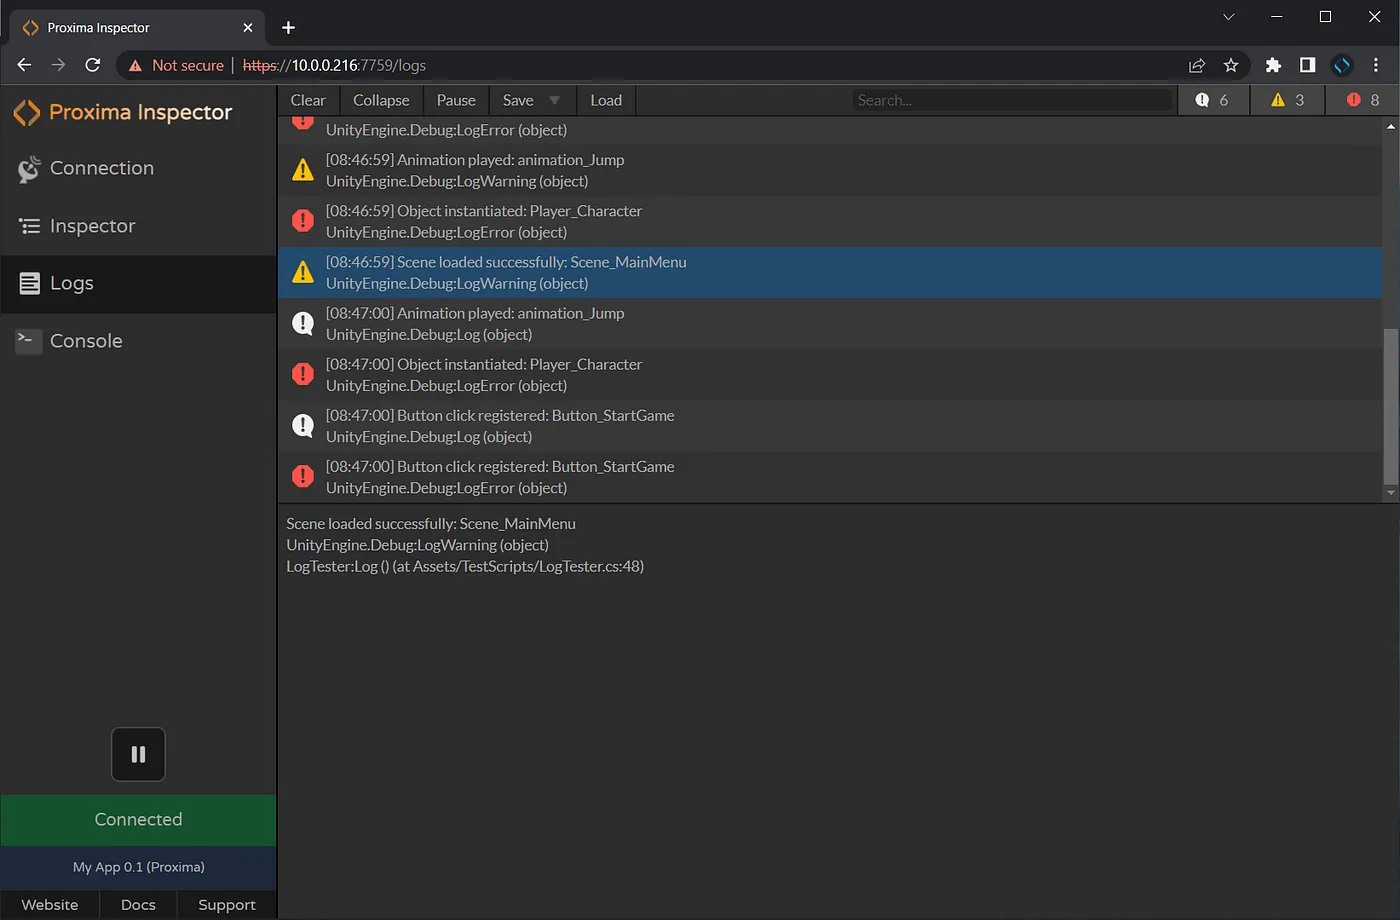
Once Proxima is installed, you can connect to your game by entering its IP address and navigate to the Logs page to view a live Unity log stream.
You can also download the log stream for offline debugging or download the Unity log file to save all logs since the game started running. View your Unity log files online (for free) by visiting https://app.unityproxima.com/logs
Bonus Tip: How to enable or disable stack traces for standalone builds
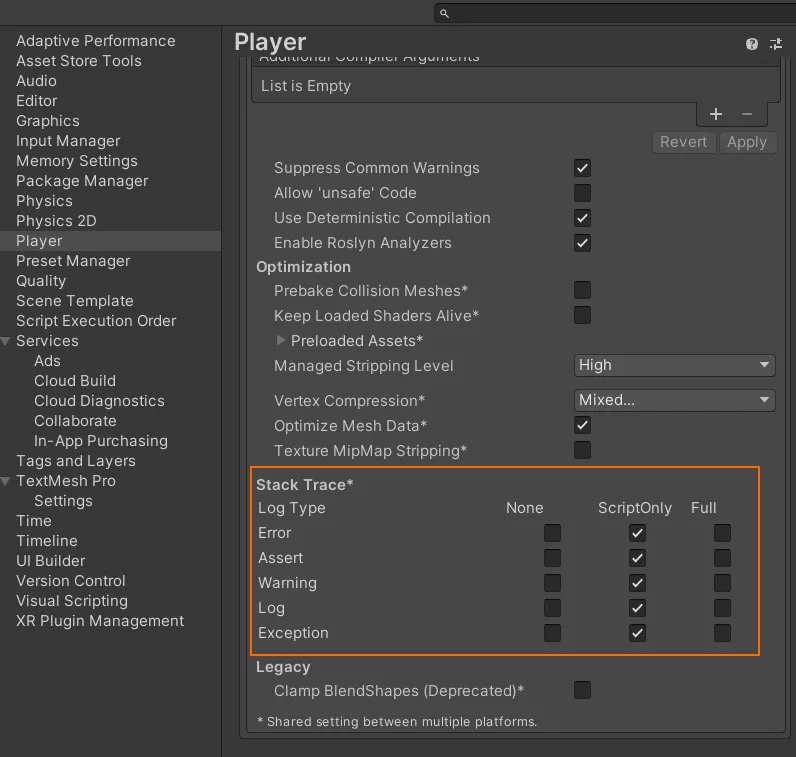
Navigate to Project Settings > Player. Open the “Other Settings” section and find “Stack Trace”.
Here you can select which types of stacks you want to see for each type of log. ScriptOnly will only display your script code, while Full will also include Unity Engine portions of the stack.
FAQ: Streaming Unity logs
Do I need a Development Build to see Unity logs? Only for the Unity Editor Console method. adb logcat, browser dev tools (WebGL), and Proxima Inspector can work without Development Build.
Why are my logs missing from adb logcat?
Make sure your device is in Developer Mode, USB debugging is enabled, and that you are filtering Unity logs with adb logcat -s Unity:V.
Can I stream logs from iOS without Xcode? The Unity Editor Console works for iOS if you can connect by device IP. For more advanced workflows, Proxima Inspector is the simplest option for release builds.
Does log streaming affect performance? Development Builds and verbose logging can slow down your game. Use verbose logging only when debugging.
Summary
- If you have a development build and the Unity editor installed, use Method 1 to connect to your game from the Unity editor.
- If you have an Android build, consider Method 2 to view the ADB log stream.
- If you have a WebGL build, see Method 3 for how to use your browser’s dev tools.
- If you want to see logs for a release build and don’t want to have to install external tools, consider Method 4 to add Proxima Inspector to your game.
I hope this article helps you on your game dev journey!
Further Reading
- Git and Unity: A Comprehensive Guide to Version Control for Game Devs
- Automating Unity Builds to iOS, macOS, and visionOS
- Automating Unity Builds with GitHub Actions
Subscribe to our Newsletter
Get the latest news and updates from Virtual Maker delivered straight to your inbox.
© 2026 Virtual Maker Corporation